Computational prediction of protein structure
A computational prediction of an unknown protein structure depends on using a homologous structure as a starting point. This will be a known protein structure that shares significant sequence homology. To develop a useful and somewhat accurate homology model, structures must usually share a minimum of 35% sequence homology. However, if significant functional/structural motifs are shared, or the proteins share an evolutionary relationship, sometimes an effective structural model can be developed for essential parts of a protein, or an active site, with local sequence conservation and less overall global sequence conservation.
The number of experimentally solved protein structures available, and the number of distinct protein folds represented has increased rapidly over recent years. As of December 2019, there are 49,107 distinct protein structures in the Protein Data Bank (PDB).1 This ever-growing pool of available solved structures is making homology modeling an ever more feasible and useful computational technique for protein structure prediction.
Identifying the template structure and sequence alignment
The first step in homology modeling is to obtain the correct sequence for your protein of interest. This could be from the UniProt/Swissprot protein sequence database2 in FASTA format. The UniProt entry will contain links to PFAM and other domain databases. It’s important to examine the domain structure of the protein of interest since multidomain proteins often contain distinctly folded domains connected by flexible linkages, and structures of individual domains may have been separately determined. After identifying whether there are one or more domains present in your protein of interest, the next step is identifying a template structure or structures on which to base the model protein structure. Usually, the higher the sequence identity between the model and template, the higher the confidence you can have in the model.
However, the quality of a template structure selected is not solely based on the percentage sequence homology. There are several other factors to consider, such as:
- How much of the template structure is complete?
- Are there parts of the template structure missing?
- What part of the solved template structure is missing? Is it a significant part of the structure which is of interest – for example in the active site or in a significant functional motif or is it a flexible loop region?
- How good is the template structure on which I am basing my model? Is it a high-resolution structure?
A template structure which does not have significant sequence homology in a region of interest, is missing residues, has poor resolution in the active site, or a significant functional motif region, would be a poor choice. Additionally, when performing a sequence alignment, preservation of the relative position of certain significant residues which constrain structure may need to be considered, for example, cysteines which might form disulfide bonds, salt bridges and metal binding sites. Often it is helpful to perform a secondary structure prediction on the protein which you are modeling to identify helices and certain structural features and assess agreement between your predicted homology model and secondary structure prediction.
There are several ways in which a template structure can be identified. One way is to use the NCBI program Blast and ‘blast’ the sequence of your protein of interest against the protein databank (make sure to select Protein Data Bank as your database). Several other web databases3 can also be used to identify domain structure, disulphide bridges and active sites for identification of good template structures or a functional/structural motif family to which the protein may be a member.
In Flare™, Cresset’s structure-based design software solution,4 template PDB coordinate structure files can be downloaded directly from the PDB web server through the File pulldown menu selection, ‘Download PDB’ where a download window will open. Once the PDB structure is displayed, a right click on the graphical window will open the extension choice ‘show in RCSB’, which opens a Flare window on the Protein Data Bank which shows information regarding the corresponding PDB entry.

Figure 1: Flare menu selections illustrating Python extensions available that facilitate homology modeling functions, including importing FASTA sequence files for alignment, mutating residues within the template structure to the protein of interest, renumbering protein residues in a structure, and a function to calculate the RMSD between two protein structures. There are functions to create Ramachandran plots, and protein contact map plots.
After alignment: Modeling loops, sequence insertions and sequence deletions
Once a template structure is selected, a sequence alignment is performed between your protein of interest and the template structure, for which you now have a set of x, y, z structural coordinates from the protein databank. The NCBI Blast will return a sequence alignment of your sequence of interest with the protein template structure. As mentioned above, it is best to examine a sequence alignment for issues mentioned previously, prior to use, and not to use a sequence alignment blindly.
Once there is a good sequence alignment between the template and protein of interest, you need to assess whether there are sections of protein or loop regions missing for which the template does not have a defined structure. Structure for these parts of the sequence will need to be identified and modeled separately, inserted and structural discontinuities and steric overlaps resolved. There may also be sections where the template has sequence, where the sequence of interest does not. Copying the coordinates form the template to the target will then cause a gap (discontinuity) in the final structure which will need to be resolved.

Figure 2: Flare has capabilities to prepare proteins (Protein Prep menu button) for modeling studies such as correcting for pH, capping chains, auto-extracting ligands, and removing atoms from residues with incomplete backbones. There are capabilities for gradient minimization and molecular dynamics using AM1-BCC or Gasteiger charges and Amber GAFF and GAFF2 force fields using OpenMM (Dyamics menu button).
Loop modeling methods fall into one of two categories – either conformationally constructed loop structures geometrically minimizing the distance bridging the structural gap, or through a fragment conformational library search where structure fragments are extracted from solved PDB structures and placed in a loop database. There are several loop modeling programs publicly available.5 Geometric computational methods6 are also available, which minimize loop conformations that satisfy spatial restraints without relying on a database of known protein structures.
Flare features an implementation of the FREAD5 loop modeling program for protein homology modeling loop insertion (figure 1).
Optimization and refinement
Once coordinates are transferred from the template to the target and loop regions are inserted, issues in the continuity of structure and steric overlap are resolved with some localized constrained minimization of the structure and some minimal molecular dynamics for structure refinement.
How good is my model?
There are several programs and web servers available to assess the overall quality of a protein homology model7. These will check protein dihedral angles, steric overlaps and assess the overall quality of the protein structure. Some will give a Ramachandran plot where it can be verified if the residue dihedral angles fall within permitted space. For example, Flare includes functions to create Ramachandran plots and protein contract map plots (as shown in the menu selection in Figure 1). Secondary structure features of proteins can be shown above the aligned sequences, structures superimposed and their RMSDs found.
Here is an example of the quality assessment provided for a homology model by the program, MolProbity.7 MolProbity is a freely available structure validation web service for identifying problems in protein structures, model structures, nucleic acid structures and complexes. Quality results for the model include a Ramachandran plot as shown. The MolProbity score for this model is 1.36 which is numerically lower than the crystallographic resolution for the template (2.85 angstroms) indicating that it is, quality-wise, better than the average structure at that resolution. Residues which reside outside the protein preferred dihedral angles, as well as rotamer angles are enumerated.
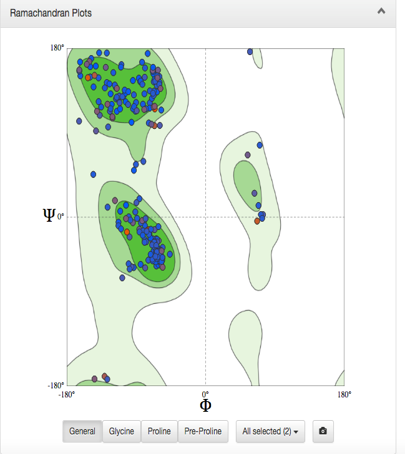
Figure 3: Ramachandran plot for a modeled protein illustrates whether the residue backbone dihedral angles, phi φ and psi Ψ, fall within permitted regions for ß-sheet, right-handed α-helix and left-handed α-helix.
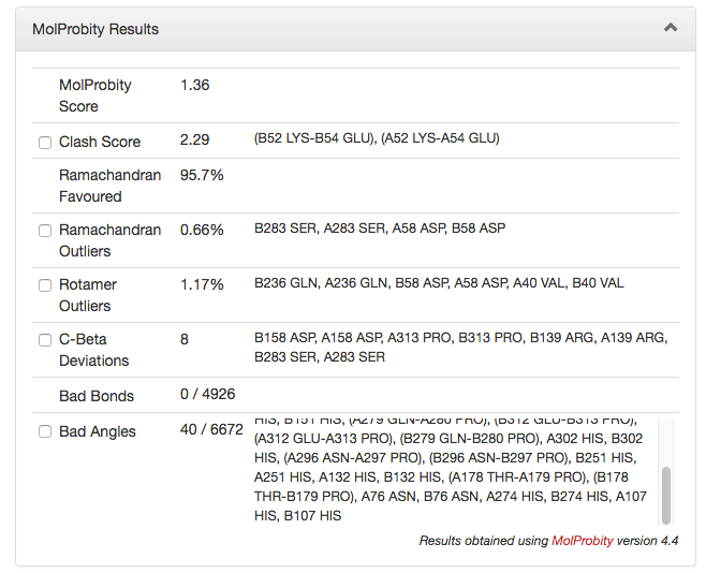
Figure 4: MolProbity results from a Homology Model check. The Molprobity score is a measure of the quality of the model. Results regarding steric clashes, whether residues fall within the angles permitted in the Ramanchandran plot and other structural problems with the homology model are provided.
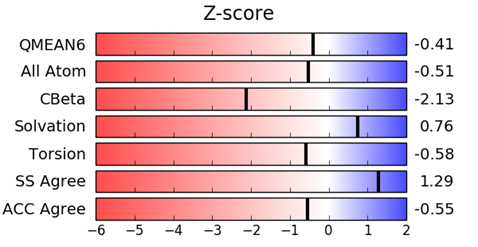 Figure 5: The QMEAN (Qualitative Model Energy Analysis) Z-score is a scoring function which is based on structural features and provides an estimate of the ‘degree of nativeness’ of the model. This indicates whether the QMEAN score of the model compares favorably with experimental structures of similar size. QMEAN Z-scores around zero indicate good agreement between the model structure and experimental structures of similar size. Scores of -4.0 or below are an indication of models with low quality.
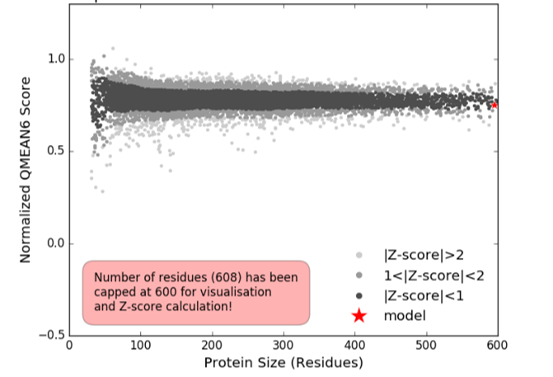
Figure 6: Comparison with non-redundant set of PDB structures.
In the comparison plot (Figure 6) the quality scores of individual models are related to the scores for similar experimental structures. The x-axis shows protein length (represented by the number of residues). The y-axis is the normalized QMEAN score. Each dot represents an experimental protein structure, and the |Z-score| indicated, the standard deviation from the mean. Our model is represented as a red star. Our model is indicated by the red star and falls within the one standard deviation from the mean, indicating it is a satisfactory model.
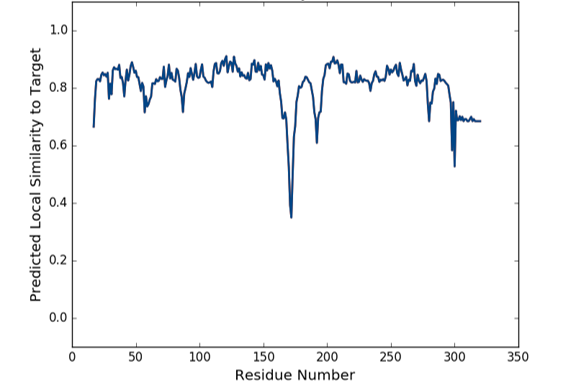
Figure 7: Local quality estimate.
There is a problem with the overall quality of the model as shown on the graph of predicted local similarity to the target between residues 150-200 (this is comparable to B values for a crystal structure) and by comparison with the non-redundant set of PDB structures and QMEANS values.
It might be possible to improve on the quality of the model by using multiple protein structures from the PDB for modeling and perform a multiple sequence alignment. Perhaps a template structure more similar in this local region (150-200) can be identified and used to create an ensemble of proteins for modeling, examining any differences through superposition of the multiple structures.
Placing structural or significant catalytic waters within the structure and/or solvating the structure and performing molecular dynamics simulations and ensuring the model structure represented the lowest energy structure might improve the quality of the model as well.
Progress your protein modeling project
Homology modeling is a complex modeling technique that requires a high degree of understanding of protein and ligand recognition systems. Cresset Discovery Services has computational scientists with significant experience in homology modeling. Contact us for a free confidential discussion to see how we can help with your protein modeling projects.
References
- Protein Data Bank
- UniProt protein sequence database
- ProSite, Conserved Domain Database, PFAM, SMART and Interpro
- Flare for structure-based design
- Publicly available loop modeling programs: ArchPRED: a template-based loop structure prediction server Fernandez-Fuentes N1, Zhai J, Fiser A. Nucleic Acids Res. 34:W173-6, 2006; DaReUS-Loop: a web server to model loops in homology models Karami Y, Rey J, Postic G, Murail S, Tufféry P, de Vries SJ. Nucleic Acids Res. W1:W423-W428, 2019; SA-Mot Mining protein loops using a structural alphabet and statistical exceptionality Regad L, Martin J, Nuel G, Camproux AC. BMC Bioinformatics, 4:11:75, 2010; SuperLooper – a prediction server for the modeling of loops in globular and membrane proteins Hildebrand, P.W. et al. Nucleic Acids Res. 37:W571—4, 2009; ArchDB 2014: structural classification of loops in proteins Jaume Bonet, Joan Planas-Iglesias, Javier Garcia-Garcia, Manuel A. Marín-López, Narcis Fernandez-Fuentes and Baldo Oliva, Nucl. Acids Res. 42(Database issue): D315–D319, 2014; FREAD revisited: Accurate loop structure prediction using a database search algorithm Choi, Y. and Deane, C.M. Proteins, 78:1431—40, 2010.
- Examples of geometric loop modeling programs: RCD+: Fast loop modeling server López-Blanco JR, Canosa-Valls AJ, Li Y, and Chacón P. NAR 44, W1: W395–W400, 2016 (limited to short loops, less than 12 residues); ModLoop ModLoop: automated modeling of loops in protein structures Fiser, A. and Sali, A. Bioinformatics,19: 2500—2501, 2003.
- Methods for checking the quality of a protein homology model: ProSA-web: interactive web service for the recognition of errors in three-dimensional structures of proteins Wiederstein & Sippl Nucleic Acids Research 35: W407-W410, 2007; WHAT IF: A molecular modeling and drug design program G.Vriend, J. Mol. Graph. 8: 52-56, 1990; What Check Errors in protein structures, R.W.W.Hooft, G.Vriend, C.Sander and E.E.Abola, Nature 381: 272 1996; MolProbity: More and better reference data for improved all-atom structure validation Williams et al. Protein Science 27: 293-315, 2018; PROCHECK – a program to check the stereochemical quality of protein structures Laskowski R A, MacArthur M W, Moss D S, Thornton J M , J. App. Cryst., 26:283-291, 1993.