Abstract
Understanding structure-activity relationships (SAR) is fundamental in many aspects of drug discovery, from exploring chemical space to lead optimization. In this case study, we use Activity Miner™ and Activity Atlas™, two components of Forge™ that will soon be available in Flare™, to analyze the complex SAR of a series of benzoxazepinone RIPK1 inhibitors.
This study shows how the SAR analysis tools in Forge can work in synergy with the Protein Interaction potentials (PIPs) and Electrostatic Complementarity™ (EC) maps in Flare to provide useful insight for ligand design.
Introduction
Receptor- interacting serine/threonine- protein kinase 1 (RIPK1) is a key mediator of inflammation and cell death. It has emerged as a promising therapeutic target for the treatment of autoimmune and inflammatory diseases as well as oncogenic diseases. Its unique structure has enabled the development of highly selective small-molecule inhibitors. Several drug candidates are progressing in the clinic for the treatment of inflammatory diseases, such as psoriasis, rheumatoid arthritis, and ulcerative colitis, as well for CNS indications such as ALS and Alzheimer’s disease, and pancreatic cancer.
A family of benzoxazepinone RIPK1 inhibitors that show complete specificity for RIPK1 was first identified from the screening against DNA encoded libraries by GlaxoSmithKline (GSK). In this study, we will explore the SAR around benzoxazepinone GSK’481 hit (Figure 1A) using Activity Atlas and Activity Miner in Flare.
Preparation and alignment of the RIPK1 inhibitors dataset
A dataset of a total of 46 compounds with an activity range spanning from pIC50 4.9 to 10.3 was downloaded from the BindingDB or extracted from the supporting information of the literature papers (by Philip A. Harris et al. at GSK). The protein-ligand crystal structure of GSK’481 bound to RIPK1 is known (PDB: 5HX6) and was downloaded from the Protein Data Bank and carefully prepared in Flare.
The dataset of molecules was checked for tautomerism and protonation state and adjusted appropriately. All molecules were then aligned to the published X-ray crystal structure of GSK’481 (PDB: 5HX6) by Maximum Common Substructure using the standard ‘very accurate but slow’ set-up for the conformation hunt and the ‘Permissive’ mode for the substructure alignment, to allow the rotation of some of the heterocyclics rings, also using a ‘hard’ protein excluded volume.
The use of a 3D similarity metric in Activity Atlas requires the generation of alignments for all compounds and can be sensitive to misalignment and alignment noise. For this reason, visual inspection of alignments is recommended, to ensure that there are no anomalies present and manual intervention can be used to improve sub-optimal alignments. Accordingly, the alignment of the thiazole compound 1 was manually adjusted by flipping/rotating the thiazole ring and benzyl ring. This aligned the benzyl ring in a manner consistent with the whole dataset. The resulting alignments are shown in Figure 1B.
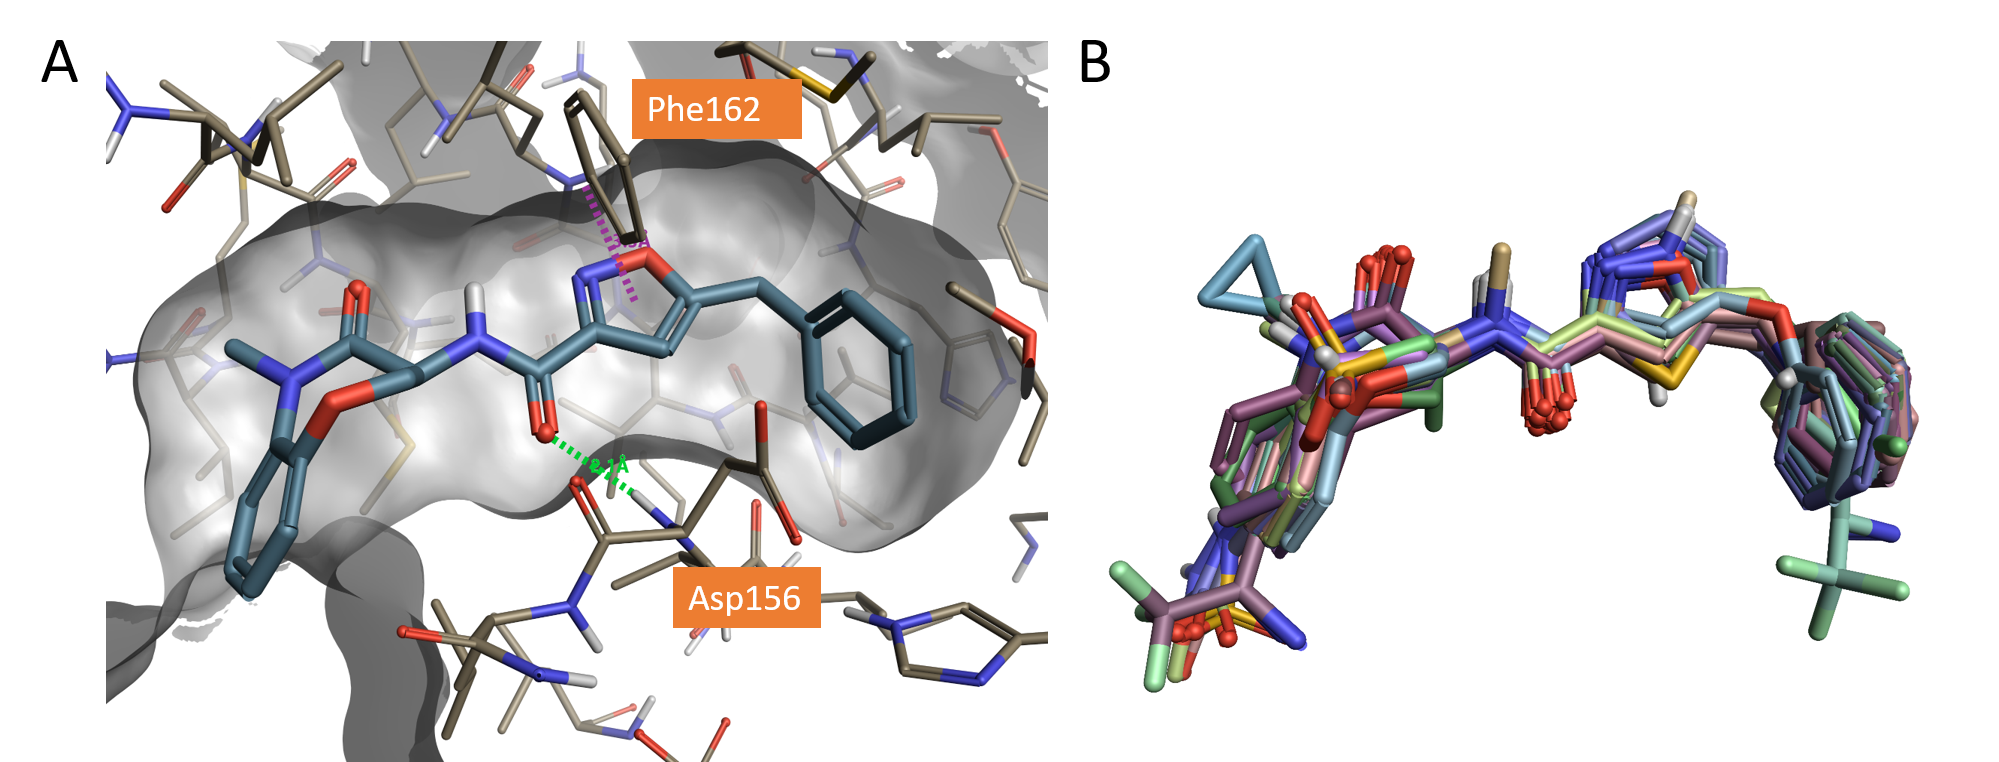
Figure 1. A. Crystallographic compound GSK’481 (pIC50 8.8) bound to the RIPK1 active site (PDB: 5HX6), hydrogen bond shown in green dashed line and pi-pi interaction shown in purple; B. Dataset of molecules aligned to the X-ray structure of GSK’481 (PDB: 5HX6) using Flare.
SAR analysis using Activity Atlas
Activity Atlas is a probabilistic method of analyzing the structure-activity relationships of a set of aligned compounds as a function of their electrostatic, hydrophobic, and shape properties. Activity Atlas is particularly useful to condense large data tables into a single picture, summarizing structure-activity data into highly visual 3D maps that inform the design and optimization of new compounds. The method uses a Bayesian approach to take a global view of the data qualitatively, taking into account the probability that a molecule is correctly aligned.
The ‘activity cliff summary’ maps generated by Activity Atlas provide an overview of the SAR landscape based on activity cliffs. We will focus on the analysis of the maps generated using ‘Normal’ model building conditions to understand the features which underlie the SAR of the RIPK1 dataset.
Activity Cliff Summary of Shape and Hydrophobics
The ‘activity cliff summary of shape’ map (Figure 2A) for this dataset indicates that RIPK1 activity is increased by having a small substituent on the lactam amide of the benzoxazepinone moiety but also that the activity decreases when larger substituents are present, as shown by the small favorable (green) areas enclosed within the larger unfavorable (magenta) areas in Figure 2A. A small variation of the cyclic ether moiety is tolerated, as shown by the favorable (green) area around this moiety. The presence of several unfavorable areas (magenta) suggests a tight binding site where only minimal variation is tolerated.
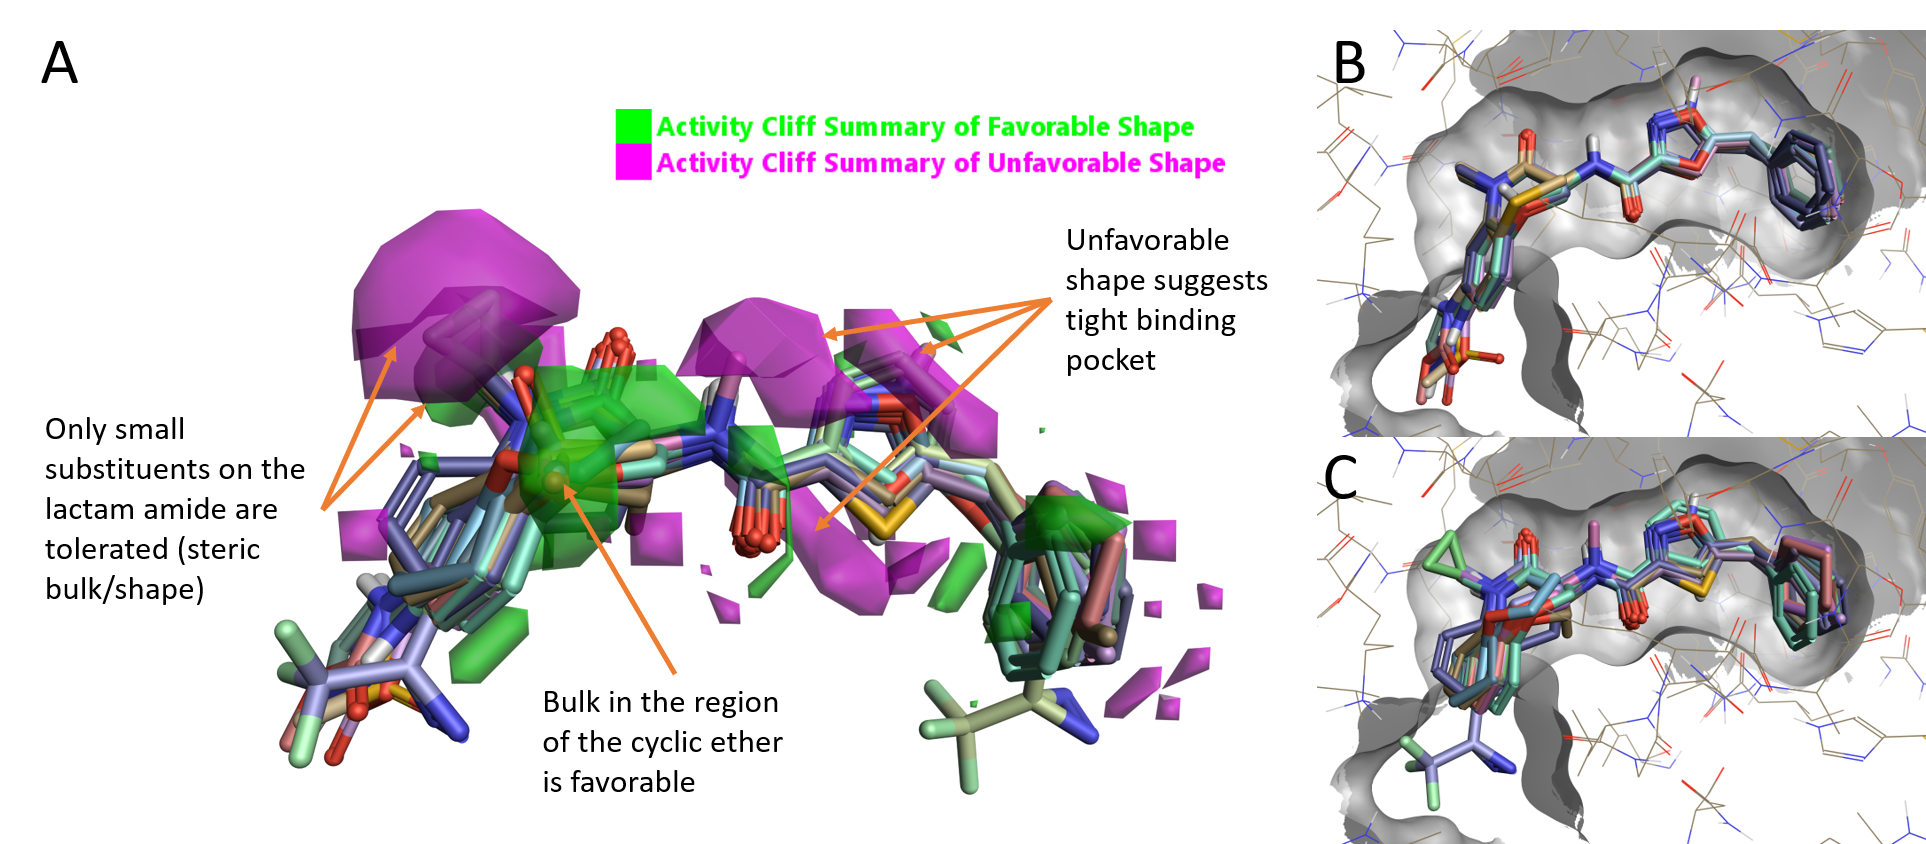
Figure 2. A. RIPK1 Activity summary of shape; B. High active compounds (pIC50 10.3-9); C. Low active compounds (pIC50 6.7-4.9).
On initial inspection of the aligned ligands in the context of the protein, there appears to be little space in the protein to accommodate small conformation changes or variations of the benzoxazepinone moiety. Highly active molecules (pIC50 10.3-9) show a very tight alignment: only the replacement of the benzoxazepinone oxygen in GSK’481 with sulfur or an NH is tolerated, and substitution on the aryl benzoxazepinone ring is only allowed on the 7-position (Figure 2B). The alignment of low active molecules (pIC50 6.7-4.9) instead shows a number of steric clashes with the protein.
Figure 3 shows the effect of N-substitution on the lactam amide of the benzoxazepinone moiety. In full agreement with the Activity Atlas map, replacing the NH moiety in compound 2 (pIC50 7.49) with NMe (GSK’481, pIC50 8.8) increases activity: larger substituents as N-Et (Compound 3, pIC50 5.5) or N-cPr (Compound 4, pIC50 5) clash with the protein and are not tolerated.

Figure 3. Substituents larger than methyl on the lactam amide are not tolerated.
For this ligand series, the Activity cliff summary of hydrophobics shows two green areas where hydrophobic substituents/moieties favor activity (Figure 4A) and a magenta area on the left side where an hydrophobic moiety leads to a decrease of the activity. In addition, we have a large area of unfavorable hydrophobics around the heterocyclic ring (isoxazole ring on GSK’481) suggesting that hydrophobicity in this part of the molecules has a detrimental effect on the activity.
Looking at the protein surface of RIPK1 colored by hydrophobicity (Figure 4B), both the CH of the isoxazole and the NMe of the lactam amide point toward a hydrophilic area (blue), in line with the Activity Atlas map.
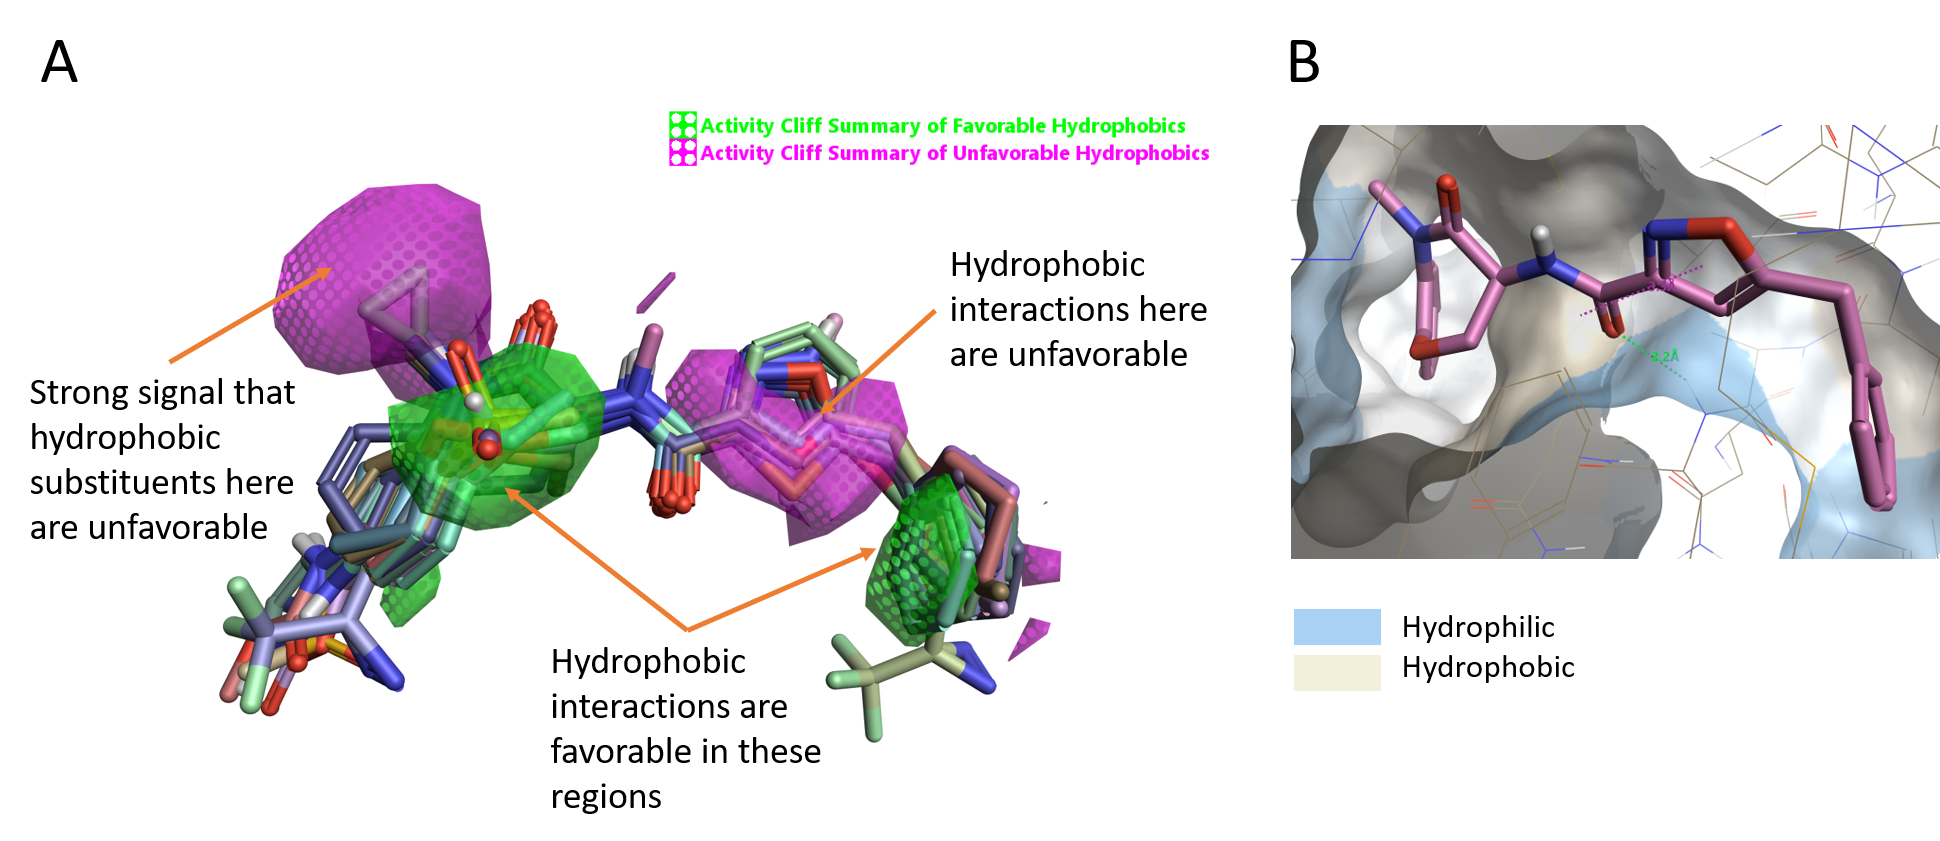
Figure 4. A. Activity cliff summary of hydrophobics map; B. Molecular surface of RIPK1 colored by hydrophobicity.
Activity Cliff Summary of Electrostatics
The ‘activity cliff summary of electrostatics’ map (Figure 5) shows well-defined areas where negative electrostatics (blue) and positive electrostatics (red) are crucial for RIPK1 activity.
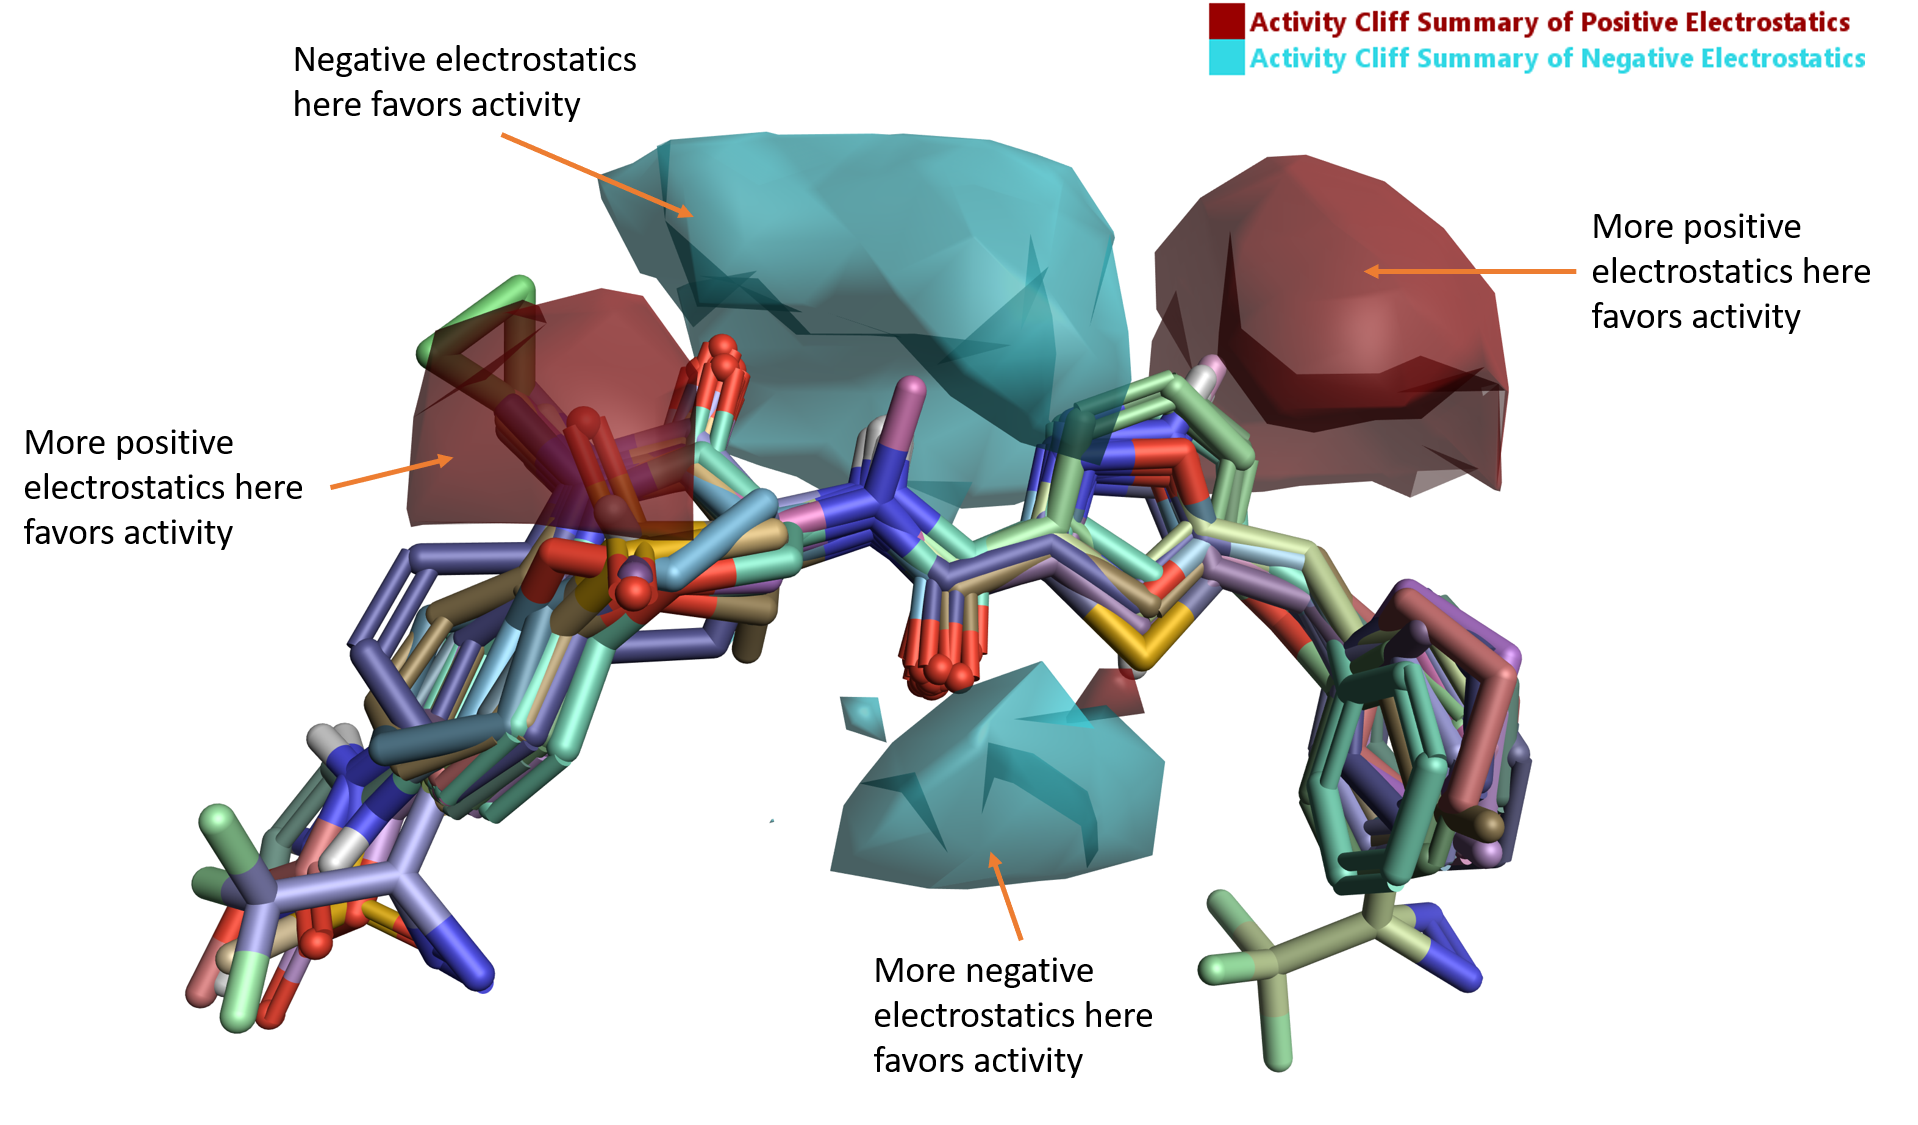
Figure 5. Activity Cliff summary of electrostatics map for RIPK1.
The region of favorable negative electrostatics beneath the aligned ligands is clearly associated with the H-bond forming carbonyl of the amide linker, which in PDB code: 5HX6 is involved in a H-bond interaction with the backbone NH of Asp156 (Figure 1A).
The larger region of favorable negative and positive electrostatics above the linker region of the aligned ligands in Figure 5 is associated with the lactam amide carbonyl and the 5-membered ring. While the favorable effect on RIPK1 activity cannot be easily explained in terms of canonical ligand-protein interactions, an analysis of the electrostatics of the active site of RIPK1 by means of Protein Interaction Potentials (PIPs) offers further insights into the trend reported by the Activity Atlas maps.
PIPs provide a detailed map of the electrostatics of the protein active and can accordingly prove invaluable for understanding ligand binding, SAR and the design of new molecules that target the protein. A visual comparison of the PIPs active site of PDB:5HX6 with the ligand fields of oxazole 5 (pIC5= 10.3, the most active compound in this series), shows that the positive field on the right of the oxazole nicely maps the negative PIPs of the RIPK1 active site. At the same time the negative field of the ligand sits in the middle of an area of positive electrostatics in the active site of RIPK1 (Figure 6 A-B). The good complementarity between ligand and protein electrostatics is also confirmed by the Electrostatic Complementarity map of oxazole 5 (Figure 6C).
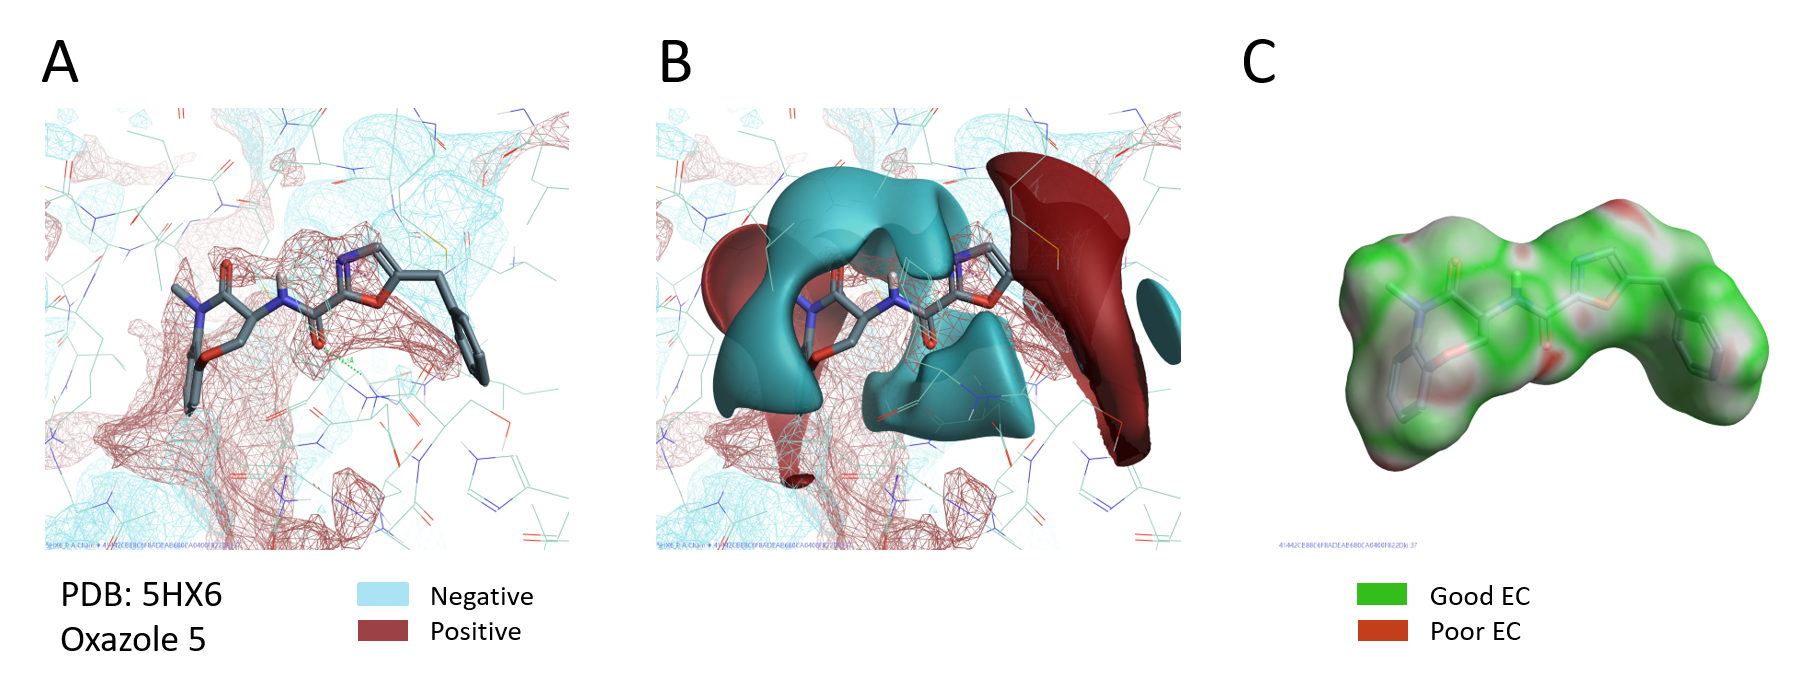
Figure 6. A. PIPs of RIPK1 (PDB: 5HX6); B. PIPs of RIPK1 and ligand electrostatic fields of oxazole 5; C. Electrostatic Complementarity of oxazole 5 to RIPK1 protein.
A detailed analysis of the effect of changing the electrostatic of the ligands on RIPK1 activity can be performed using the Activity Miner component, which drills down into the Activity Atlas maps to understand subtle molecule-to molecule structure-activity changes and identify potential outliers.
Detailed SAR analysis with Activity Miner
Activity Miner enables the rapid navigation of complex SAR, highlighting key activity changes between pairs of molecules and giving a clear rationale for the changes in the activity. It also provides inspiration for how to exploit this knowledge for future design iterations. Activity Miner uses the concept of ‘disparity’ or ‘activity cliffs’ to highlight regions in the SAR landscape where small changes in structure generate large changes in activity.
Activity Miner was used in combination to ligand field differences and PIPs to investigate a critical region of the SAR, working on a subset of 17 molecules where the isoxazole ring moiety of GSK’481 was replaced by alternative heterocycles (Table1).
Table 1. Ring variations and their RIPK1 pIC50.
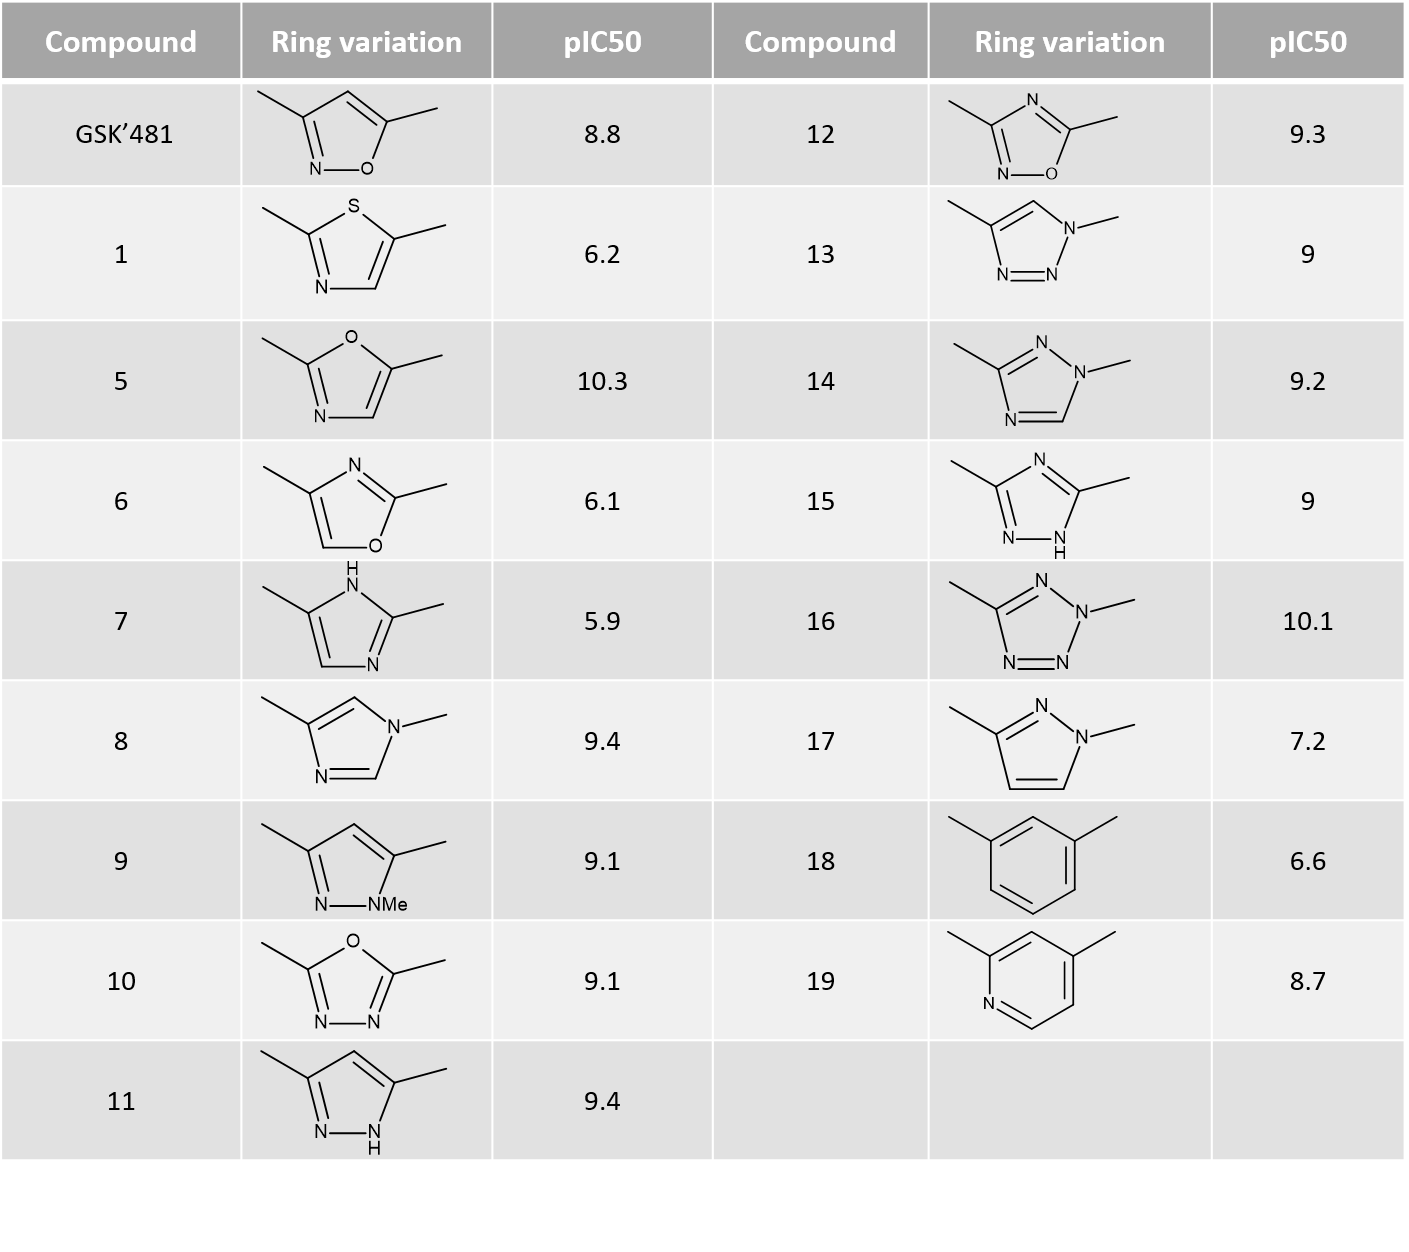
The ‘top pairs’ table in Activity Miner lists the molecule pairs with the highest disparity for the chosen activity, allowing you to see the molecular changes with the largest influence on RIPK1 pIC50. Exploring the ligand field differences (regions where the ligand field in one molecule is either more positive or negative than in the other) for most top pairs (Figure 7 and 8) confirms that higher RIPK1 pIC50 is consistently associated to heterocycles showing a more negative field on the left side (typically associated to an aromatic nitrogen), and a more positive field on the right side, in agreement with both the Activity Atlas maps and the PIPs for RIPK1.
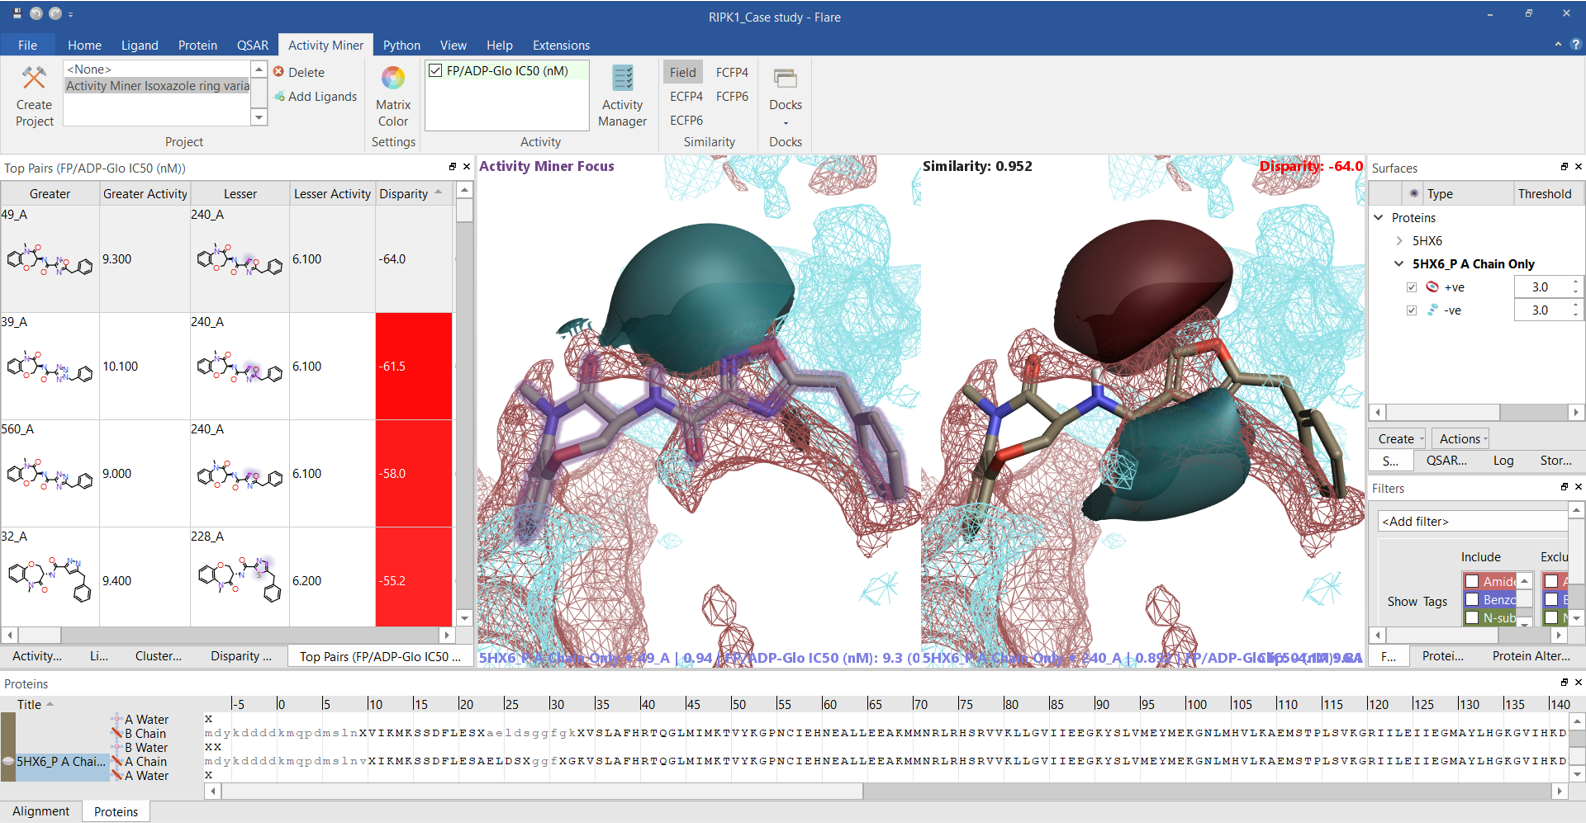
Figure 7. The Activity Miner ‘Top Pairs’ table lists the molecule pairs with the highest disparity for the chosen activity. Ligand electrostatics is shown as field differences, i.e., regions where one molecule is more positive (red) or negative (blue) than the other. For each top pair, the most active compound is shown on the left, and the less active compound on the right. The PIPs for the RIPK1 protein are also displayed. Color coding: red = positive electrostatics, blue = negative electrostatics.
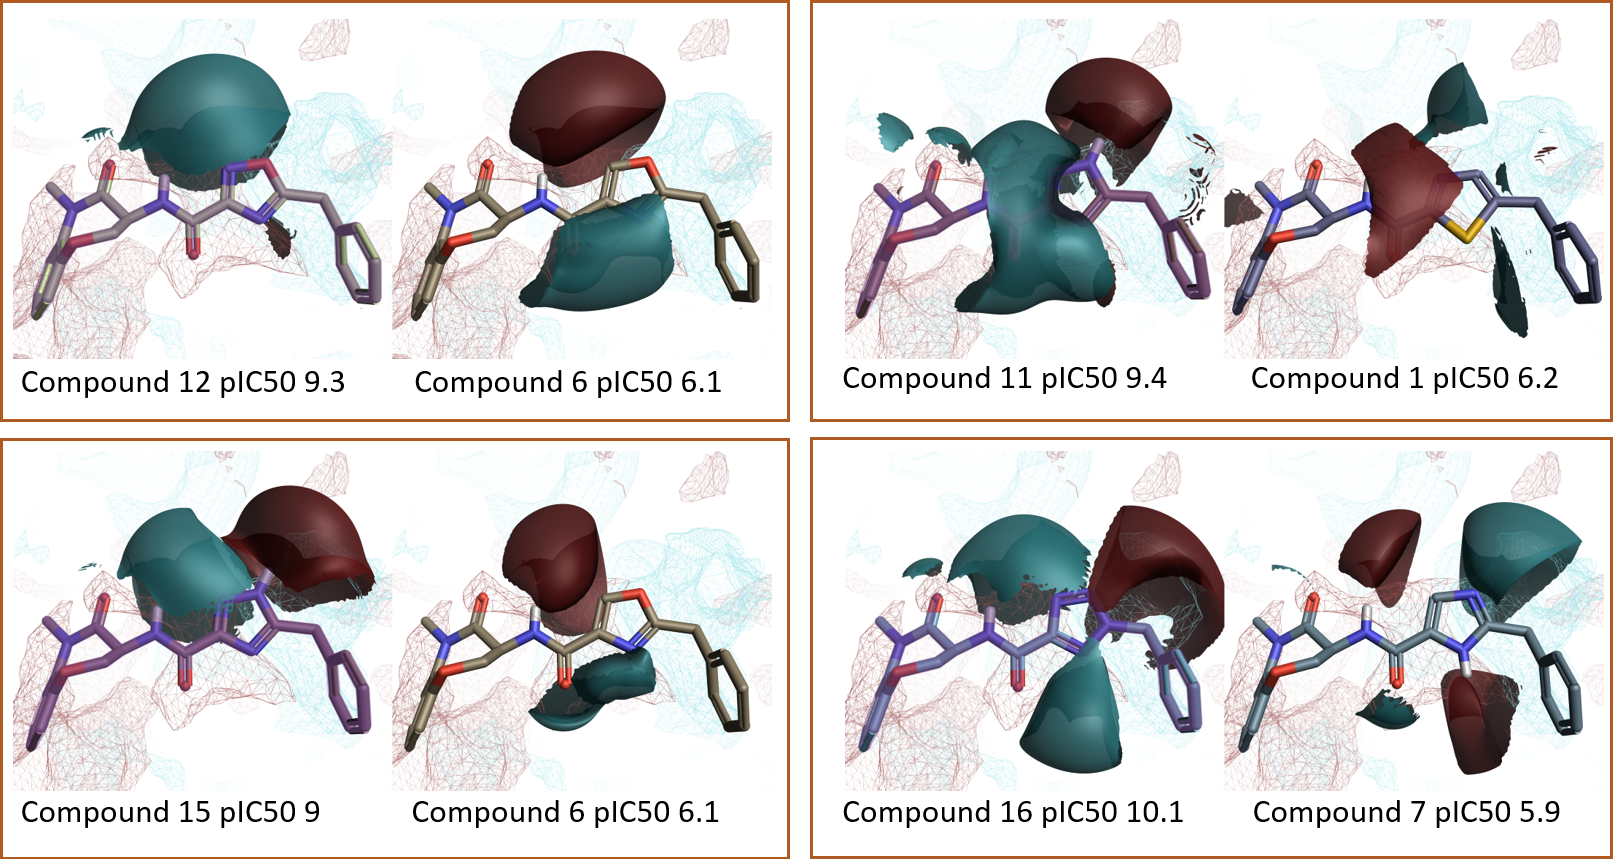
Figure 8. Additional examples from the Activity Miner ‘Top Pairs’ table. Ligand electrostatics shown as field differences on top of protein PIPs for the RIPK1 active site. Color coding: red = positive electrostatics, blue = negative electrostatics.
The in-depth investigation of the SAR with Activity Miner also highlighted a possible outlier to this general trend. Thiazole 1 (pIC50 6.2) possesses very similar electrostatics to oxazole 5 (pIC50 10.3) but is much less active (Figure 9A). A possible explanation is that the larger size of the sulfur atom could alter the orientation of the thiazole and/or the benzyl group resulting in a suboptimal fit into the binding pocket. The higher lipophilicity of the thiazole might also contribute to the lower activity of compound 1, as the thiazole ring sits near an hydrophilic area in the protein (Figure 9 B-C).
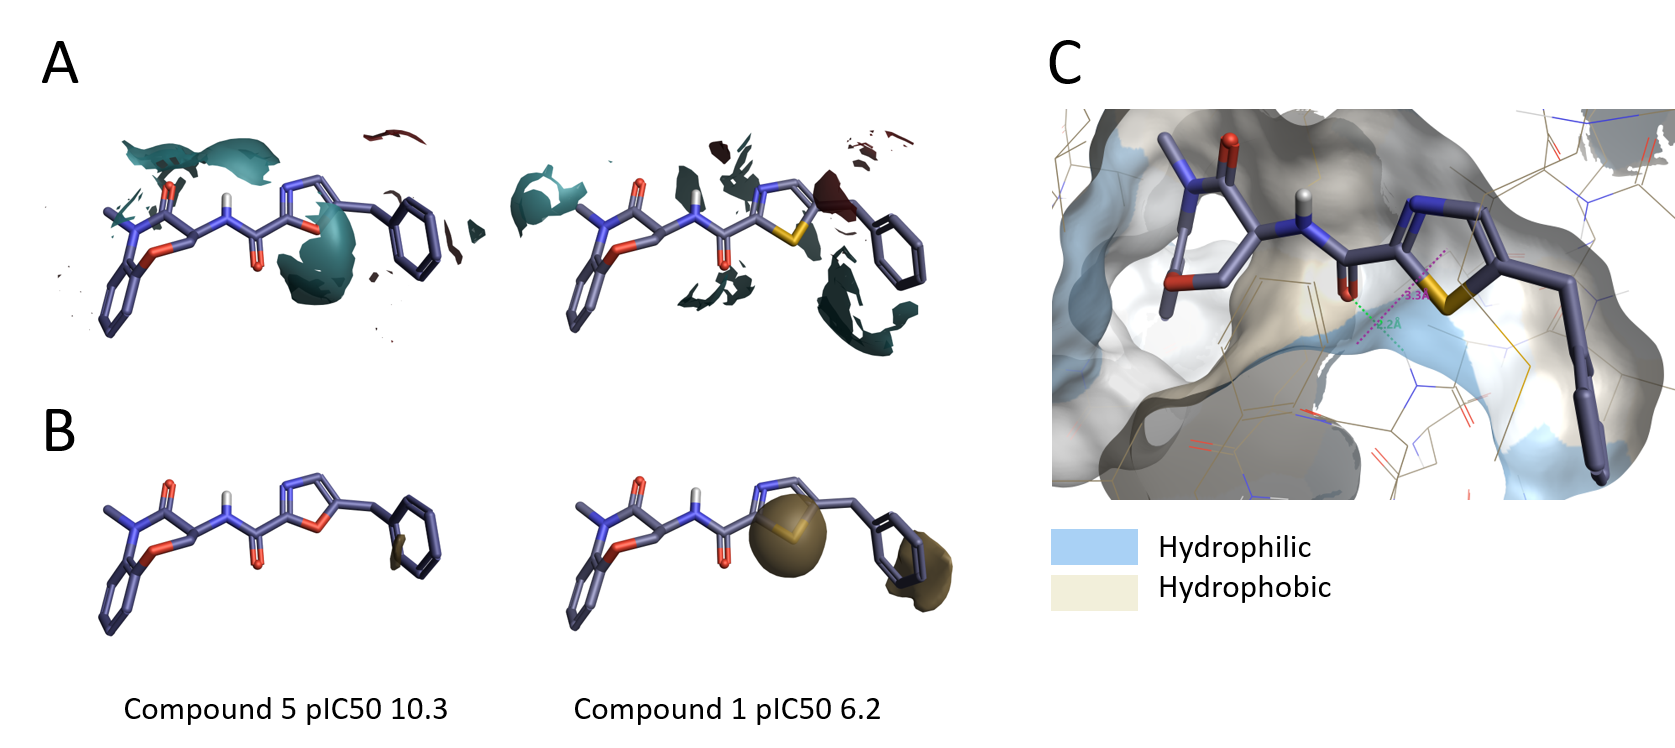
Figure 9. A. Electrostatic ligand field differences between oxazole 5 and thiazole 1; B. Hydrophobic field differences between oxazole 5 and thiazole 1; C. Thiazole 1 in active site of RIPK1, molecular surface of the protein colored by hydrophobicity.
SAR analysis using Electrostatic Complementarity maps
Electrostatic Complementarity (EC) maps of a ligand towards a protein are calculated by comparing the values of electrostatic potential for the ligand and the protein at all vertex points of the ligand’s solvent excluded surface. Regions of the ligand surface where there is electrostatic complementarity with the protein are colored green, while the regions where there is an electrostatic clash are colored red.
The EC scores quantify the ligand-protein electrostatic complementarity with three different metrics suitable for diverse protein-ligand scenarios.
Figure 10 shows the EC maps for some compounds from Table 1, shown in order of decreasing RIPK1 activity from left to right.
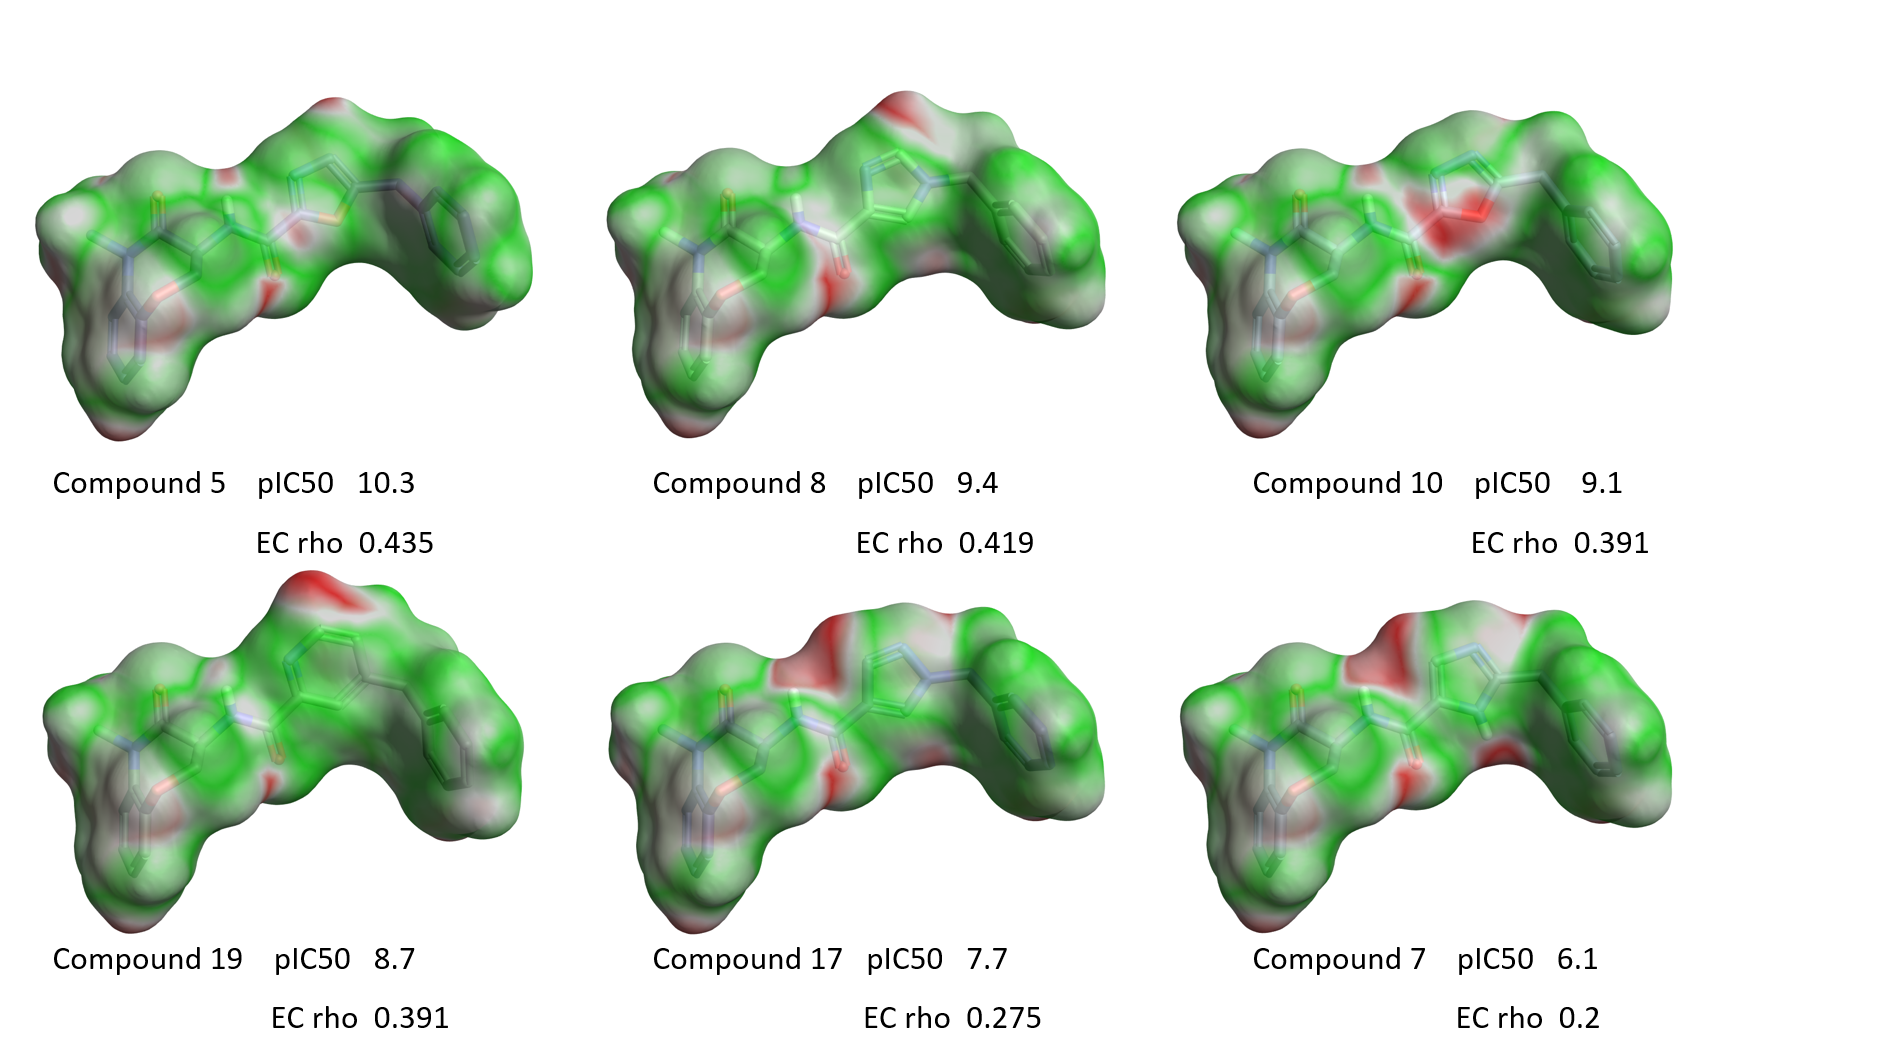
Figure 10. EC maps of a few examples with variation around the isoxazole ring. Green, good electrostatic complementarity; red, electrostatic clash.
A clear qualitative trend can be observed, with larger red areas of electrostatic clash appearing as the activity of the ligands decreases. This trend is confirmed by the plot of RIPK1 pIC50 versus the ‘Complementarity rho’ score shown in Figure 11 A. Two clear outliers are thiazole 1, which as previously discussed might have a slightly different binding mode due to the size and hydrophilicity of the sulfur atom, and oxazole 6 whose aligned conformation shows an internal hydrogen clash and electron lone pair repulsion (Figure 11 B). Most likely both compounds adopt a different conformation when binding to the active site of RIPK1.
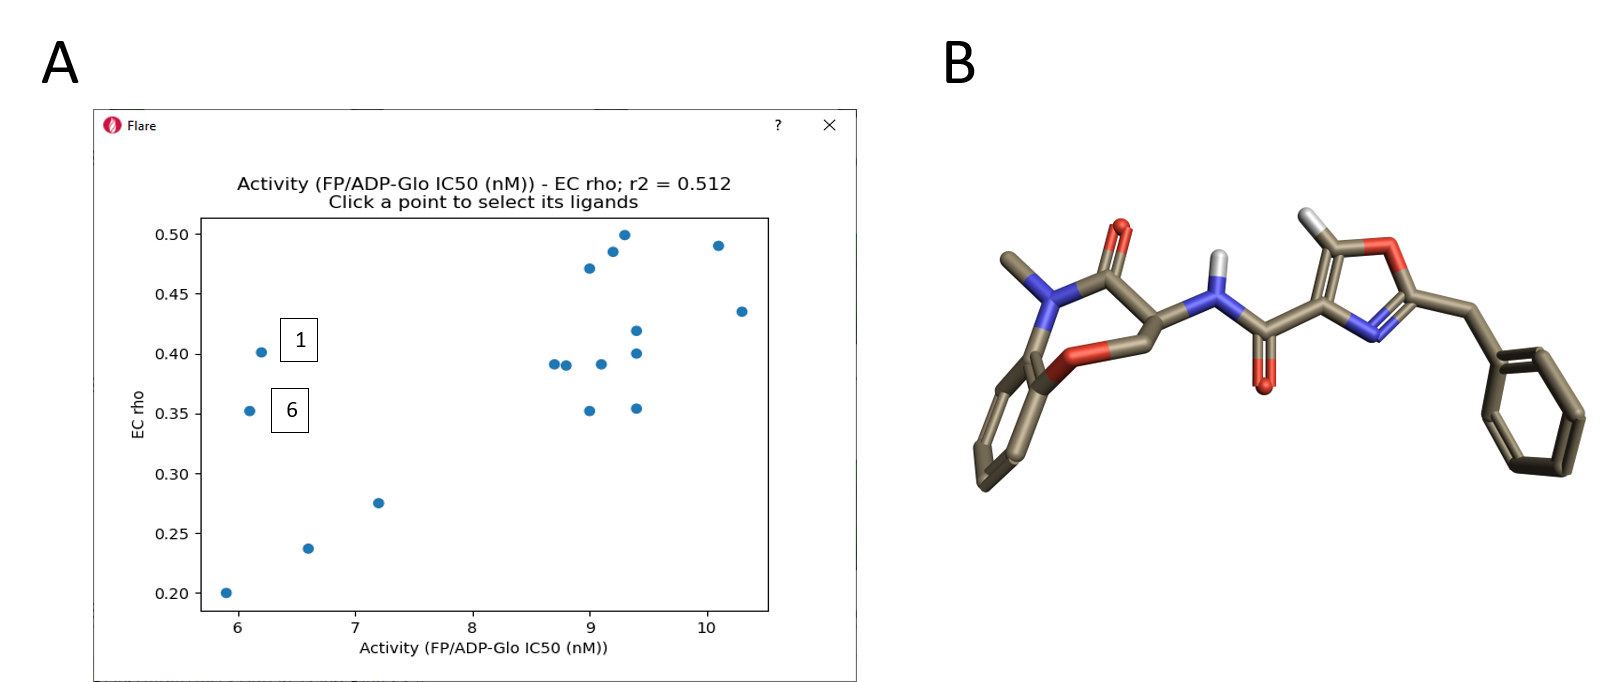
Figure 11. A. Correlation of EC scores with activity range; B. Aligned conformation of oxazole 6.
Conclusion
The full integration of Forge methods to Flare (due for release summer 2021) enables a synergistic interaction between ligand and structure-based methods, providing a more efficient approach to SAR analysis, ligand design and drug discovery.