It is often the case in drug discovery that a new hit series of compounds against a therapeutic target must be further developed by the team. As medicinal chemistry and biological testing resources are often limited, thereby hampering synthesis efforts, computational chemistry can be used to help prioritize a set of compounds to make and test.
The computational chemistry toolbox offers many techniques which can help prioritize compounds for synthesis and testing. One technique gaining in popularity is Free Energy Perturbation (FEP) as successfully demonstrated in our paper Assessment of Binding Affinity via Alchemical Free Energy Calculations J. Chem. Inf. Model. 2020. When correctly executed, it can accurately calculate the relative binding free energy of a closely related (or congeneric) series of ligands. However, not all targets (or ligand series) are amenable to the FEP technique, so it is important to validate whether your system can be described by FEP before embarking on a very computationally demanding endeavor.
In this blog post, I will explore the scientific prerequisites for a successful FEP project in the Flare structure-based design platform.
Carefully prepared 3D structure
To run an FEP simulation, a 3D structure is required for the target. This would ideally be a high-resolution crystal structure. While lower resolution structures could be used, there will be more ambiguity in the structural co-ordinates, which in turn could result in more error in the subsequent FEP calculation.
Regardless of the initial quality of the starting point, careful preparation of the target structure will need to be done. This would include carefully considering the protonation states of ionizable residues such as histidine, or for example, two closely positioned aspartic acid side-chains in an aspartyl protease. Andy Smith, Discovery Services Scientist at Cresset Discovery Services, has discussed what needs to be considered when preparing a protein structure. Another consideration is whether to include water molecules from the 3D structure for FEP simulations. It is generally advantageous to include bridging water molecules between ligand and protein, as well as groups of water molecules located in sub-pockets within the binding site.
FEP uses molecular dynamics (MD) simulations so it is essential that any missing side chains and residues are added. Once this has been done, it will be important to check the stability of the system. It is possible that, after the addition of missing atoms, the protein could become unstable during the MD simulation leading to abrupt changes in position on some of the atoms. This would in turn lead to an inaccurate FEP calculation. The length of the MD test will be dependent on how long the FEP simulations will be, but several runs of between 20-50ns would be a good initial test.
Known binding mode for your ligands
For a successful FEP calculation, it is crucial to know how at least one of your ligand series binds. Ideally, the initial crystal structure should contain a member of the congeneric ligand series that is being studied. Binding of a ligand can often result in a conformation change in the target allowing for an induced fit of the ligand; this would be reflected in the 3D structure where the ligand is bound. It is possible to dock the congeneric series into an apo structure to get a binding hypothesis, but any associated induced fit will not be modeled, and this would lead to errors in the binding hypothesis, which in turn would give incorrect results in the FEP calculation. In this case it is essential that the protein-ligand complex be extensively equilibrated using molecular dynamics prior to starting the FEP calculation.
Known Structure Activity Relationships
A critical part of the FEP validation of your system is the ability to accurately reproduce the known relative binding free energy of the ligand series. Ideally, the ΔG values should be available, but these could also be calculated from the Ki values using ΔG=RTlnKi. In the absence of Ki values, the IC50 values could be used as an approximation to this, but it is critical that these values come from the same assay (and ideally read on the same batch). Mixing results from different assays would result in a heterogeneous dataset that would not be a good starting point for validating FEP. The error bars associated with a well-behaved FEP simulation are around +/- 1kcal/mol, which means ligand series need to span at least two orders of magnitude for FEP to be useful.
Ideally, at least 10 ligands with known activity are needed to run a validation study. Their charge must be the same across the series and the total number of atom changes between pairs of connected ligands should not exceed 10. All the ligands in the series must be tightly aligned with the reference ligand in the crystal structure, and there should be no significant clashes between the target and the aligned ligands.
Validation experiment
Once the structural and experimental data are available, it is now possible to validate the FEP simulation for the ligand series of interest against the given target.
The first stage in setting up an FEP experiment is to generate the perturbation map, which relates the molecules in the ligand series to one another. With the Flare FEP implementation setting up a perturbation map for the purposes of validation is done in ‘benchmark mode’. The generation of the perturbation map ensures that all the ligands which are most structurally similar are connected together, and where possible, within a cycle. If the link score goes below a minimum threshold, or if the substituent involves a ring change, then an intermediate may need to be added. It is also worth increasing the number of lambda windows for larger transitions, as such changes would benefit from more discrete steps. Atom mapping of each ligand-pair should also be checked to ensure the pairs of atoms between the two molecules are going to be morphed into the correct atom. Incorrect atom mapping will be a source of error in the final calculation.
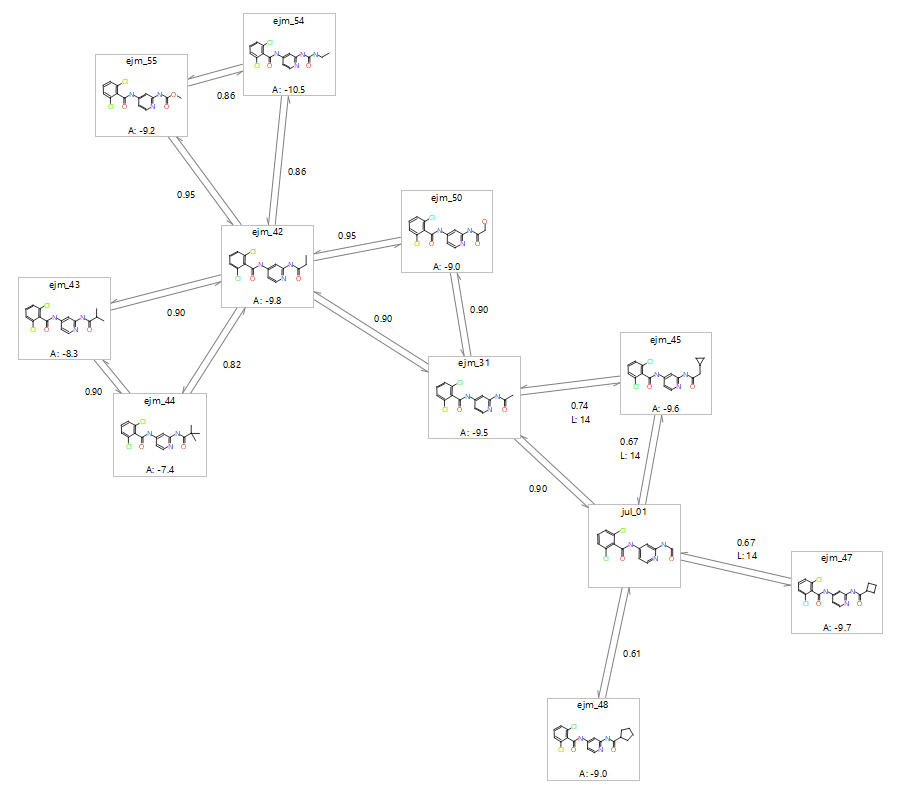
Figure 1: Possible perturbation map for a congeneric series of tyk2 ligands as generated in the Flare GUI. Each link is a dual link which considers the transition from ligand A into Ligand B, and the reverse direction Ligand B into Ligand A.
After running the calculation, look out for the following issues.
Links with large hysteresis
If a link has a large hysteresis value (the ΔG change in the forward and reverse directions differs by a significant amount) there is possibly an issue with that link. This could be due to different causes, for example: a lack of conformational sampling in a very flexible ligand; incorrect atom mapping between the two molecules; or evidence that the ligand unbinds itself from the site.
By clicking on the problematic link in the Flare GUI, it will show you the molecules at the start and end points of both the forward and reverse transformations. This will allow you to visually inspect the start and end points of the link to see if there are major structural changes. If you have two subsections of a perturbation map, and they are connected by a link with a large hysteresis, then it is advisable to add extra links to the map in order to ensure the relative energies between both map sections are correctly calculated.
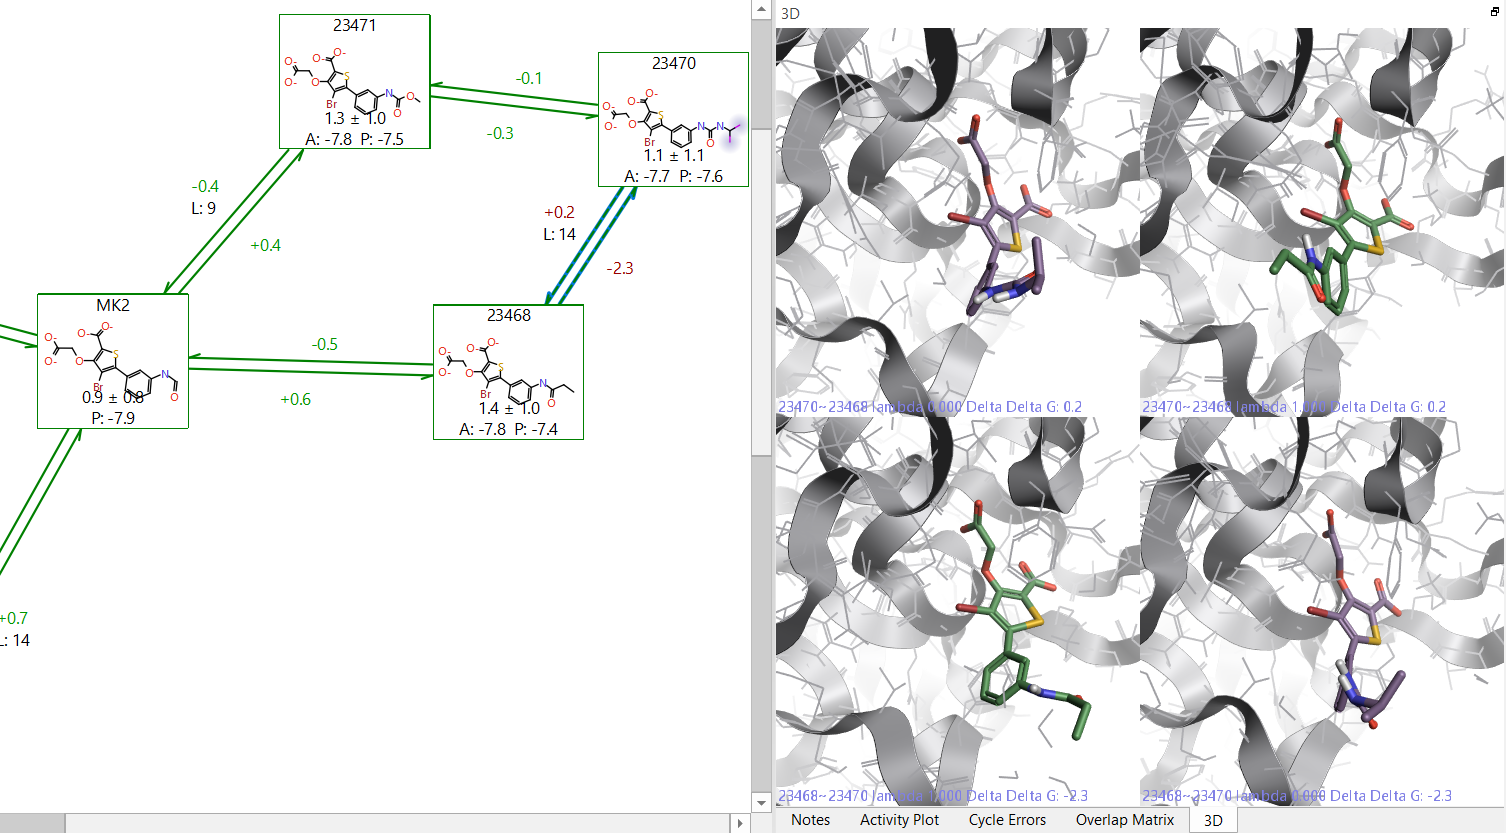
Figure 2: Example of a link with high hysteresis. On the right side it is possible to see that 23468 has a different orientation of the terminal group in the forward and reverse directions.
In the Flare GUI, it is possible to check the atom mappings between a selected molecule pair and subsequently change the mapping if it is incorrect. The edited link between the molecule pair can then be resubmitted for calculation.
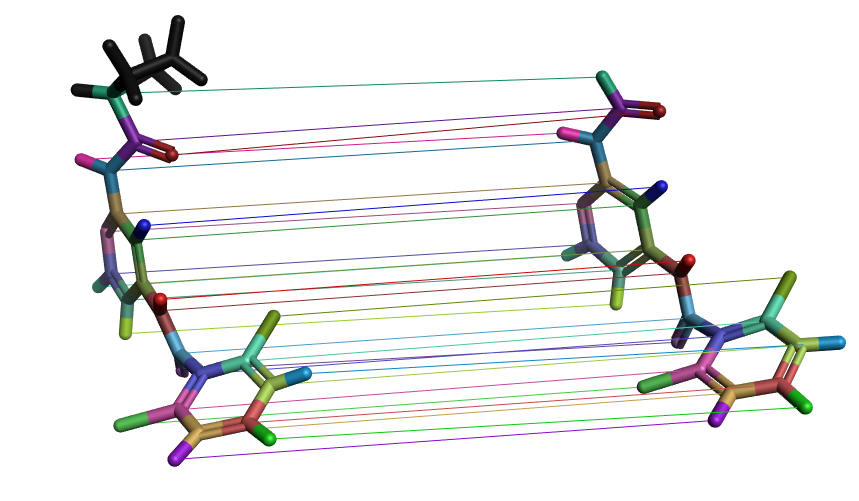
Figure 3. Visualization of atom mappings between a molecule pair in a FEP perturbation map. Each colored line represents one mapping, with the corresponding atoms in the same color. These mappings can be edited in the Flare GUI if they are incorrect.
Check the cycle errors
Further consideration should be given to cycle errors. It is useful to have the two-way link calculation to identify hysteresis effects, but errors can cancel out so that no hysteresis for specific links is observed. If the errors are systematic, they will be identified by summing the individual energetic terms in a cycle. The total energy change for a cycle should be 0 kcal/mol, but if there is deviation away from this by 2kcal/mol or more this might suggest that there is an underlying error in the description of the connected molecules. This may indicate that a longer simulation time is required (more lambda windows and/or increased simulation time per window), or it could mean that at least one of the torsions described by the underlying forcefield is not described well. If you suspect this might be the cause it is possible to generate an improved custom FF torsional parameter which follows a QM-calculated torsion barrier. This can then be used in the FEP calculation.
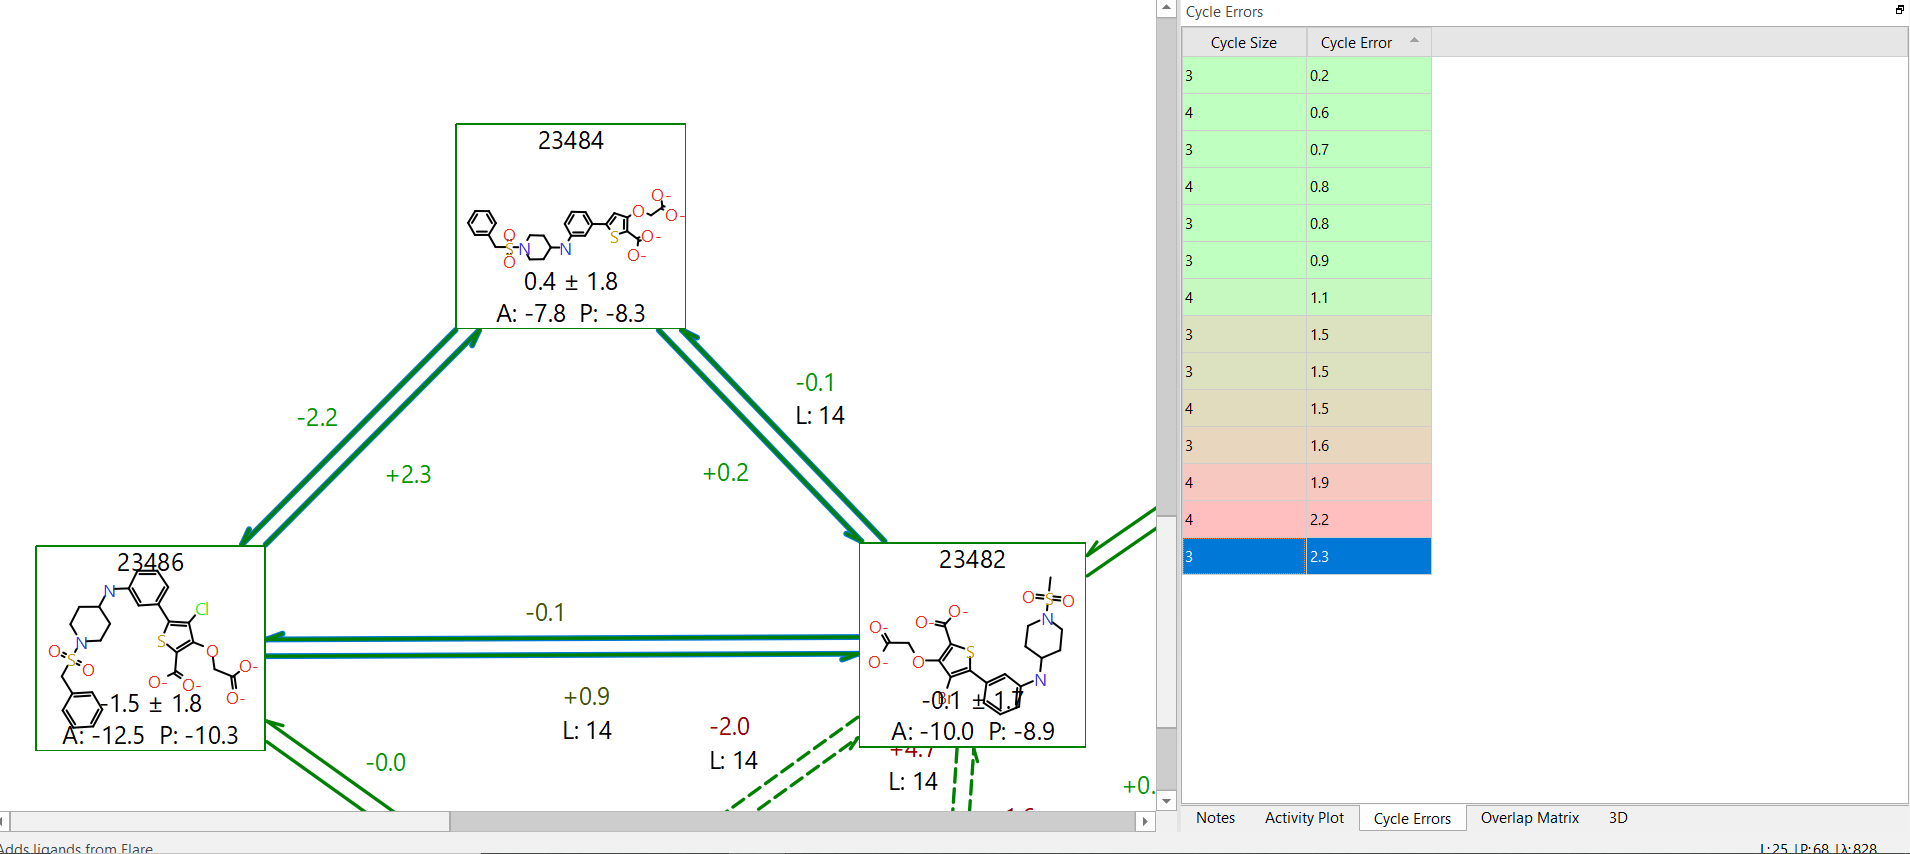
Figure 4. Example of a large error in energy change within a cycle, yet hysteresis values for the individual links are reasonable.
Compare predicted and experimental activity
Ideally, when the experimental and predicted relative binding energies are compared they should lie on the line of unity. However, the accuracy of FEP calculations is within the range +/- 1kcal/mol. A plot of experimental versus predicted ΔG makes it easy to identify ligands that fall outside this error window. Any of the reasons above could result in a large discrepancy. Once all the problems have been solved, the value of the Mean Unsigned Error (MUE) should be as low as possible. If the R2 and MUE are both good, then the system is ready to be run in production mode.
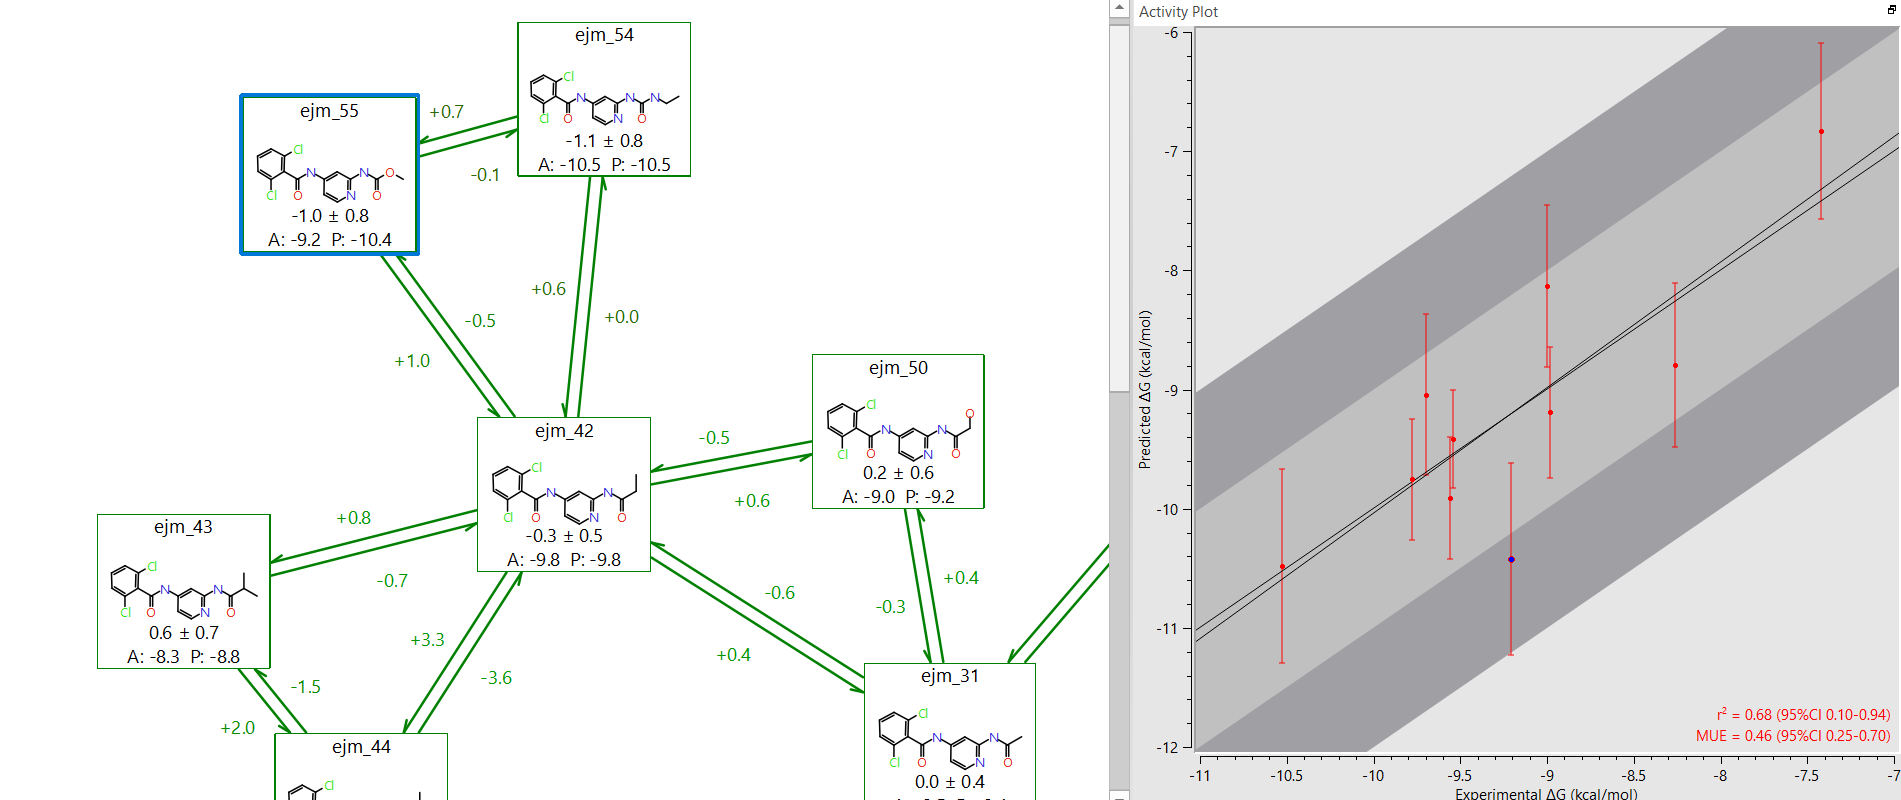
Figure 5: In Flare it is easy to identify potential outliers on the experimental-predicted activity plot.
Conclusions
Validating a target and series of ligands for FEP simulation will take time. You need to ensure your experimental data is consistent and reliable, and that you have good structural data for the series you are looking at. Initial FEP runs need to ensure that the ligands are well connected in the perturbation map and that there are no systematic or set-up errors that skew the results. Tools in the Flare GUI help identify and potentially solve such issues. Once these issues have been identified and solved, and that there is good correlation between the experimental and predicted relative binding energies, then your system will be ready to predict the relative binding energies of proposed molecules before they are synthesized.
Try Flare on your project
See the flexible licensing options for Flare and request a free evaluation to try it on your project.